Grafana und Helm - Teil 1 | Das Setup

Wer mit Kubernetes und Prometheus arbeitet, kennt wahrscheinlich auch die Visualisierungs-Software Grafana.
In diesem Artikel zeigen wir welche Möglichkeiten der Paketmanager Helm bietet Grafana auf Deinem Kubernetes Cluster zu konfigurieren und zu verwenden.

Dazu solltest Du dich vorher mit Helm auseinandergesetzt haben, hier erklären wir Dir die Grundlagen.

\

Ausgangssituation

Wir haben ein Kubernetes Cluster mit dem Namespace monitoring, worin ein whoami Service und Prometheus laufen.
Vom whoami werden Metriken exportiert, die wir gerne über Prometheus mit Grafana visualisieren wollen.

$ helm install -n prometheus --namespace monitoring stable/prometheus
$ git clone git@github.com:bee42/whoamI.git
$ cd whoamI/whoami/
$ helm dependencies update
$ helm install -n whoami --namespace monitoring --set image.tag=2.2.0 .


\

Das Deployment

Eine erste, einfache Version lässt sich mithilfe der Default-Konfiguration des Helm-Charts deployen.

$ helm install -n grafana --namespace monitoring stable/grafana


Dadurch werden alle nötigen Resourcen angelegt und eine einsatzbereite Version von Grafana gestartet.
Um von Deinem Client aus den Service erreichen zu können, bietet sich als kurzfristige Lösung ein port-forwarding an.

$ kubectl port-forward -n monitoring svc/grafana 3000:80
Forwarding from 127.0.0.1:3000 -> 3000
Forwarding from [::1]:3000 -> 3000


Für den Login werden Username und Passwort benötigt.
Der Standard User ist “admin” und das Passwort lässt sich aus dem automatisch erzeugten Secret entnehmen:

$ kubectl get secret -n monitoring grafana -o jsonpath="{.data.admin-password}" | base64 --decode ; echo
u7DtVthVmnuUV3zzhdUp53CMgEch6bSKo5XATvw9


Grafana ist dann unter 127.0.0.1:3000 erreichbar.


Grafana - Login Screen

\

Konfiguration von Grafana

Um Konfigurationen an Grafana selbst vorzunehmen gibt es den Chart Parameter “grafana.ini”.
Über diesen lassen sich Änderungen bspw. bezüglich der User- oder Security-Einstellungen vornehmen.
Auf der offiziellen Website von Grafana ist eine Liste aller Einstellungsmöglichkeiten zu finden.

Bsp. (values.yaml):

[...]
  grafana.ini:
    users:
      allow_sign_up: true
    security:
      admin_password: "mypassword"
[...]


\

Dashboards & Datasources

Da man sein Grafana üblicherweise mehr als ein einziges Mal deployen möchte (ohne jedes Mal die Dashboards und Datasources manuell setzen zu müssen), gibt es die Möglichkeit diese direkt mit auszuliefern.

Die sinnvollste Variante dafür ist das Sidecar Pattern zu nutzen. Pro Datenquelle und Dashboard wird eine ConfigMap angelegt und diese anhand eines Labels von Grafana automatisch importiert. Dafür müssen die Sidecars aktiviert und die Labels zur Identifizierung gesetzt werden.

values.yaml

[...]
  sidecar:
    dashboards:
      enabled: true
      label: grafana_dashboard
    datasources:
      enabled: true
      label: grafana_datasource
[...]

templates/my-dashboard-cm.yaml
1 2 3 4 5 6 7 8 9 10 11 12 13 14 15 16 17 18 19 20 21 22 23 24 25 26 27 28 29 30 31 32 33 34 35 36 37 38 39 40 41 42 43 44 45 46 47 48 49 50 51 52 53 54 55 56 57 58 59 60 61 62 63 64 65 66 67 68 69 70 71 72 73 74 75 76 77 78 79 80 81 82 83 84 85 86 87 88 89 90 91 92 93 94 95 96 97 98 99 100 101 102 103 104 105 106 107 108 109 110 111 112 113 114 115 116 117 118 119 120 121 122 123 124 125 126 127 128 129 130 131 132 133 134 135 136 137 138 139 140 141 142 143 144 145 146 147 148 149 150 151 152 153 154 155 156 157 158 159 160 161 162 163 164 165 166 167 168 169 170 171 172 173 174 175 176 177 178 179 180 181 182 183 184 185 186 187 188 189 190 191 192 193 194 195 196 197 198 199 200 201 202 203 204 205 206 207 208 209 210 211 212 213 214 215 216 217 218 219 220 221 222 223 224 225 226 227 228 229 230 231 232 233 234 235 236 237 238 239 240 241 242 243 244 245 246 247 248 249 250 251 252 253 254 255 256 257 258 259 260 261 262 263 264 265 266 267 268 269 270 271 272 273 274 275 276 277 278 279 280 281 282 283 284 285 286 287 288 289 290 291 292 293 294 295 296 297 298 299 300 301 302 303 304 305 306 307 308 309 310 311 312 313 314 315 316 317 318 319 320 321 322 323 324 325 326 327 328 329 330 331 332 333 334 335 336 337 338 339 340 341 342 343 344 345 346 347 348 349 350 351 352 353 354 355 356 357 358 359 360 361 362 363 364 365 366 367 368 369
apiVersion: v1
kind: ConfigMap
metadata:
  name: my-dashboard-name
  labels:
    grafana_dashboard: "1"
data:
  k8s-dashboard.json: |-
    {
      "annotations": {
        "list": [
          {
            "builtIn": 1,
            "datasource": "-- Grafana --",
            "enable": true,
            "hide": true,
            "iconColor": "rgba(0, 211, 255, 1)",
            "name": "Annotations & Alerts",
            "type": "dashboard"
          }
        ]
      },
      "editable": true,
      "gnetId": null,
      "graphTooltip": 0,
      "id": 1,
      "links": [],
      "panels": [
        {
          "collapsed": false,
          "gridPos": {
            "h": 1,
            "w": 24,
            "x": 0,
            "y": 0
          },
          "id": 8,
          "panels": [],
          "repeat": null,
          "title": "Who Am I",
          "type": "row"
        },
        {
          "aliasColors": {
            "1xx": "#EAB839",
            "2xx": "#7EB26D",
            "3xx": "#6ED0E0",
            "4xx": "#EF843C",
            "5xx": "#E24D42"
          },
          "bars": false,
          "dashLength": 10,
          "dashes": false,
          "datasource": "Prometheus",
          "description": null,
          "editable": true,
          "error": false,
          "fill": 1,
          "grid": {},
          "gridPos": {
            "h": 7,
            "w": 24,
            "x": 0,
            "y": 1
          },
          "id": 1,
          "isNew": true,
          "legend": {
            "alignAsTable": false,
            "avg": false,
            "current": false,
            "hideEmpty": false,
            "hideZero": false,
            "max": false,
            "min": false,
            "rightSide": true,
            "show": true,
            "sideWidth": null,
            "sort": null,
            "sortDesc": false,
            "total": false,
            "values": false
          },
          "lines": true,
          "linewidth": 2,
          "links": [],
          "nullPointMode": "connected",
          "paceLength": 10,
          "percentage": false,
          "pointradius": 5,
          "points": false,
          "renderer": "flot",
          "repeat": null,
          "seriesOverrides": [],
          "stack": false,
          "steppedLine": false,
          "targets": [
            {
              "datasource": "",
              "expr": "sum(irate(http_requests_total{handler=\"whoamI\", code=~\"1..\"}[2m]))",
              "format": "time_series",
              "instant": false,
              "interval": "",
              "intervalFactor": 1,
              "legendFormat": "1xx",
              "metric": "",
              "refId": "A",
              "step": 10,
              "target": ""
            },
            {
              "datasource": "",
              "expr": "sum(irate(http_requests_total{handler=\"whoamI\", code=~\"2..\"}[2m]))",
              "format": "time_series",
              "instant": false,
              "interval": "",
              "intervalFactor": 1,
              "legendFormat": "2xx",
              "metric": "",
              "refId": "B",
              "step": 10,
              "target": ""
            },
            {
              "datasource": "",
              "expr": "sum(irate(http_requests_total{handler=\"whoamI\", code=~\"3..\"}[2m]))",
              "format": "time_series",
              "instant": false,
              "interval": "",
              "intervalFactor": 1,
              "legendFormat": "3xx",
              "metric": "",
              "refId": "C",
              "step": 10,
              "target": ""
            },
            {
              "datasource": "",
              "expr": "sum(irate(http_requests_total{handler=\"whoamI\", code=~\"4..\"}[2m]))",
              "format": "time_series",
              "instant": false,
              "interval": "",
              "intervalFactor": 1,
              "legendFormat": "4xx",
              "metric": "",
              "refId": "D",
              "step": 10,
              "target": ""
            },
            {
              "datasource": "",
              "expr": "sum(irate(http_requests_total{handler=\"whoamI\", code=~\"5..\"}[2m]))",
              "format": "time_series",
              "instant": false,
              "interval": "",
              "intervalFactor": 1,
              "legendFormat": "5xx",
              "metric": "",
              "refId": "E",
              "step": 10,
              "target": ""
            }
          ],
          "thresholds": [],
          "timeFrom": null,
          "timeRegions": [],
          "timeShift": null,
          "title": "Whoami QPS",
          "tooltip": {
            "msResolution": true,
            "shared": true,
            "sort": 0,
            "value_type": "cumulative"
          },
          "type": "graph",
          "xaxis": {
            "buckets": null,
            "mode": "time",
            "name": null,
            "show": true,
            "values": []
          },
          "yaxes": [
            {
              "decimals": null,
              "format": "ops",
              "label": null,
              "logBase": 1,
              "max": null,
              "min": 0,
              "show": true
            },
            {
              "decimals": null,
              "format": "short",
              "label": null,
              "logBase": 1,
              "max": null,
              "min": 0,
              "show": false
            }
          ],
          "yaxis": {
            "align": false,
            "alignLevel": null
          }
        },
        {
          "aliasColors": {},
          "bars": false,
          "dashLength": 10,
          "dashes": false,
          "datasource": "Prometheus",
          "description": null,
          "editable": true,
          "error": false,
          "fill": 1,
          "grid": {},
          "gridPos": {
            "h": 7,
            "w": 24,
            "x": 0,
            "y": 8
          },
          "id": 2,
          "isNew": true,
          "legend": {
            "alignAsTable": false,
            "avg": false,
            "current": false,
            "hideEmpty": false,
            "hideZero": false,
            "max": false,
            "min": false,
            "rightSide": true,
            "show": true,
            "sideWidth": null,
            "sort": null,
            "sortDesc": false,
            "total": false,
            "values": false
          },
          "lines": true,
          "linewidth": 2,
          "links": [],
          "nullPointMode": "connected",
          "paceLength": 10,
          "percentage": false,
          "pointradius": 5,
          "points": false,
          "renderer": "flot",
          "repeat": null,
          "seriesOverrides": [],
          "stack": false,
          "steppedLine": false,
          "targets": [
            {
              "datasource": "",
              "expr": "sum(irate(http_request_duration_microseconds{handler=\"whoamI\", quantile=\"0.5\"}[2m]))",
              "format": "time_series",
              "instant": false,
              "interval": "",
              "intervalFactor": 2,
              "legendFormat": "0.5 quantile",
              "metric": "",
              "refId": "A",
              "step": 10,
              "target": ""
            },
            {
              "datasource": "",
              "expr": "sum(irate(http_request_duration_microseconds{handler=\"whoamI\", quantile=\"0.99\"}[2m]))",
              "format": "time_series",
              "instant": false,
              "interval": "",
              "intervalFactor": 2,
              "legendFormat": "0.99 quantile",
              "metric": "",
              "refId": "B",
              "step": 10,
              "target": ""
            }
          ],
          "thresholds": [],
          "timeFrom": null,
          "timeRegions": [],
          "timeShift": null,
          "title": "Whoami latency",
          "tooltip": {
            "msResolution": true,
            "shared": true,
            "sort": 0,
            "value_type": "cumulative"
          },
          "type": "graph",
          "xaxis": {
            "buckets": null,
            "mode": "time",
            "name": null,
            "show": true,
            "values": []
          },
          "yaxes": [
            {
              "decimals": null,
              "format": "µs",
              "label": null,
              "logBase": 1,
              "max": null,
              "min": 0,
              "show": true
            },
            {
              "decimals": null,
              "format": "short",
              "label": null,
              "logBase": 1,
              "max": null,
              "min": 0,
              "show": false
            }
          ],
          "yaxis": {
            "align": false,
            "alignLevel": null
          }
        }
      ],
      "refresh": "5s",
      "schemaVersion": 18,
      "style": "dark",
      "tags": [],
      "templating": {
        "list": []
      },
      "time": {
        "from": "now-30m",
        "to": "now"
      },
      "timepicker": {
        "refresh_intervals": [
          "5s",
          "10s",
          "30s",
          "1m",
          "5m",
          "15m",
          "30m",
          "1h",
          "2h",
          "1d"
        ],
        "time_options": [
          "5m",
          "15m",
          "1h",
          "6h",
          "12h",
          "24h",
          "2d",
          "7d",
          "30d"
        ]
      },
      "timezone": "utc",
      "title": "Example RED Metrics",
      "uid": "C1UOydkWk",
      "version": 1
    }
templates/my-datasource-cm.yaml
1 2 3 4 5 6 7 8 9 10 11 12 13 14 15 16 17 18 19 20 21 22 23 24 25 26 27
apiVersion: v1
kind: ConfigMap
metadata:
  name: my-datasource-name
  labels:
    grafana_datasource: "1"
data:
  datasource.yaml: |-
    # config file version
    apiVersion: 1
    datasources:
      # <string, required> name of the datasource. Required
    - name: Prometheus
      # <string, required> datasource type. Required
      type: prometheus
      # <string, required> access mode. proxy or direct (Server or Browser in the UI). Required
      access: proxy
      # <int> org id. will default to orgId 1 if not specified
      orgId: 1
      # <string> url
      url: http://prometheus-server:80
      # <map> fields that will be converted to json and stored in json_data
      jsonData:
        timeInterval: "15s"
      version: 1
      # <bool> allow users to edit datasources from the UI.
      editable: true


Das Ergebnis ist ein einfaches Dashboard zur Überwachung unserer whoami Anwendung.
Hinweis: Damit das Dashboard Daten anzeigt, muss der whoami Service einige Male aufgerufen werden!

Grafana - Dashboard

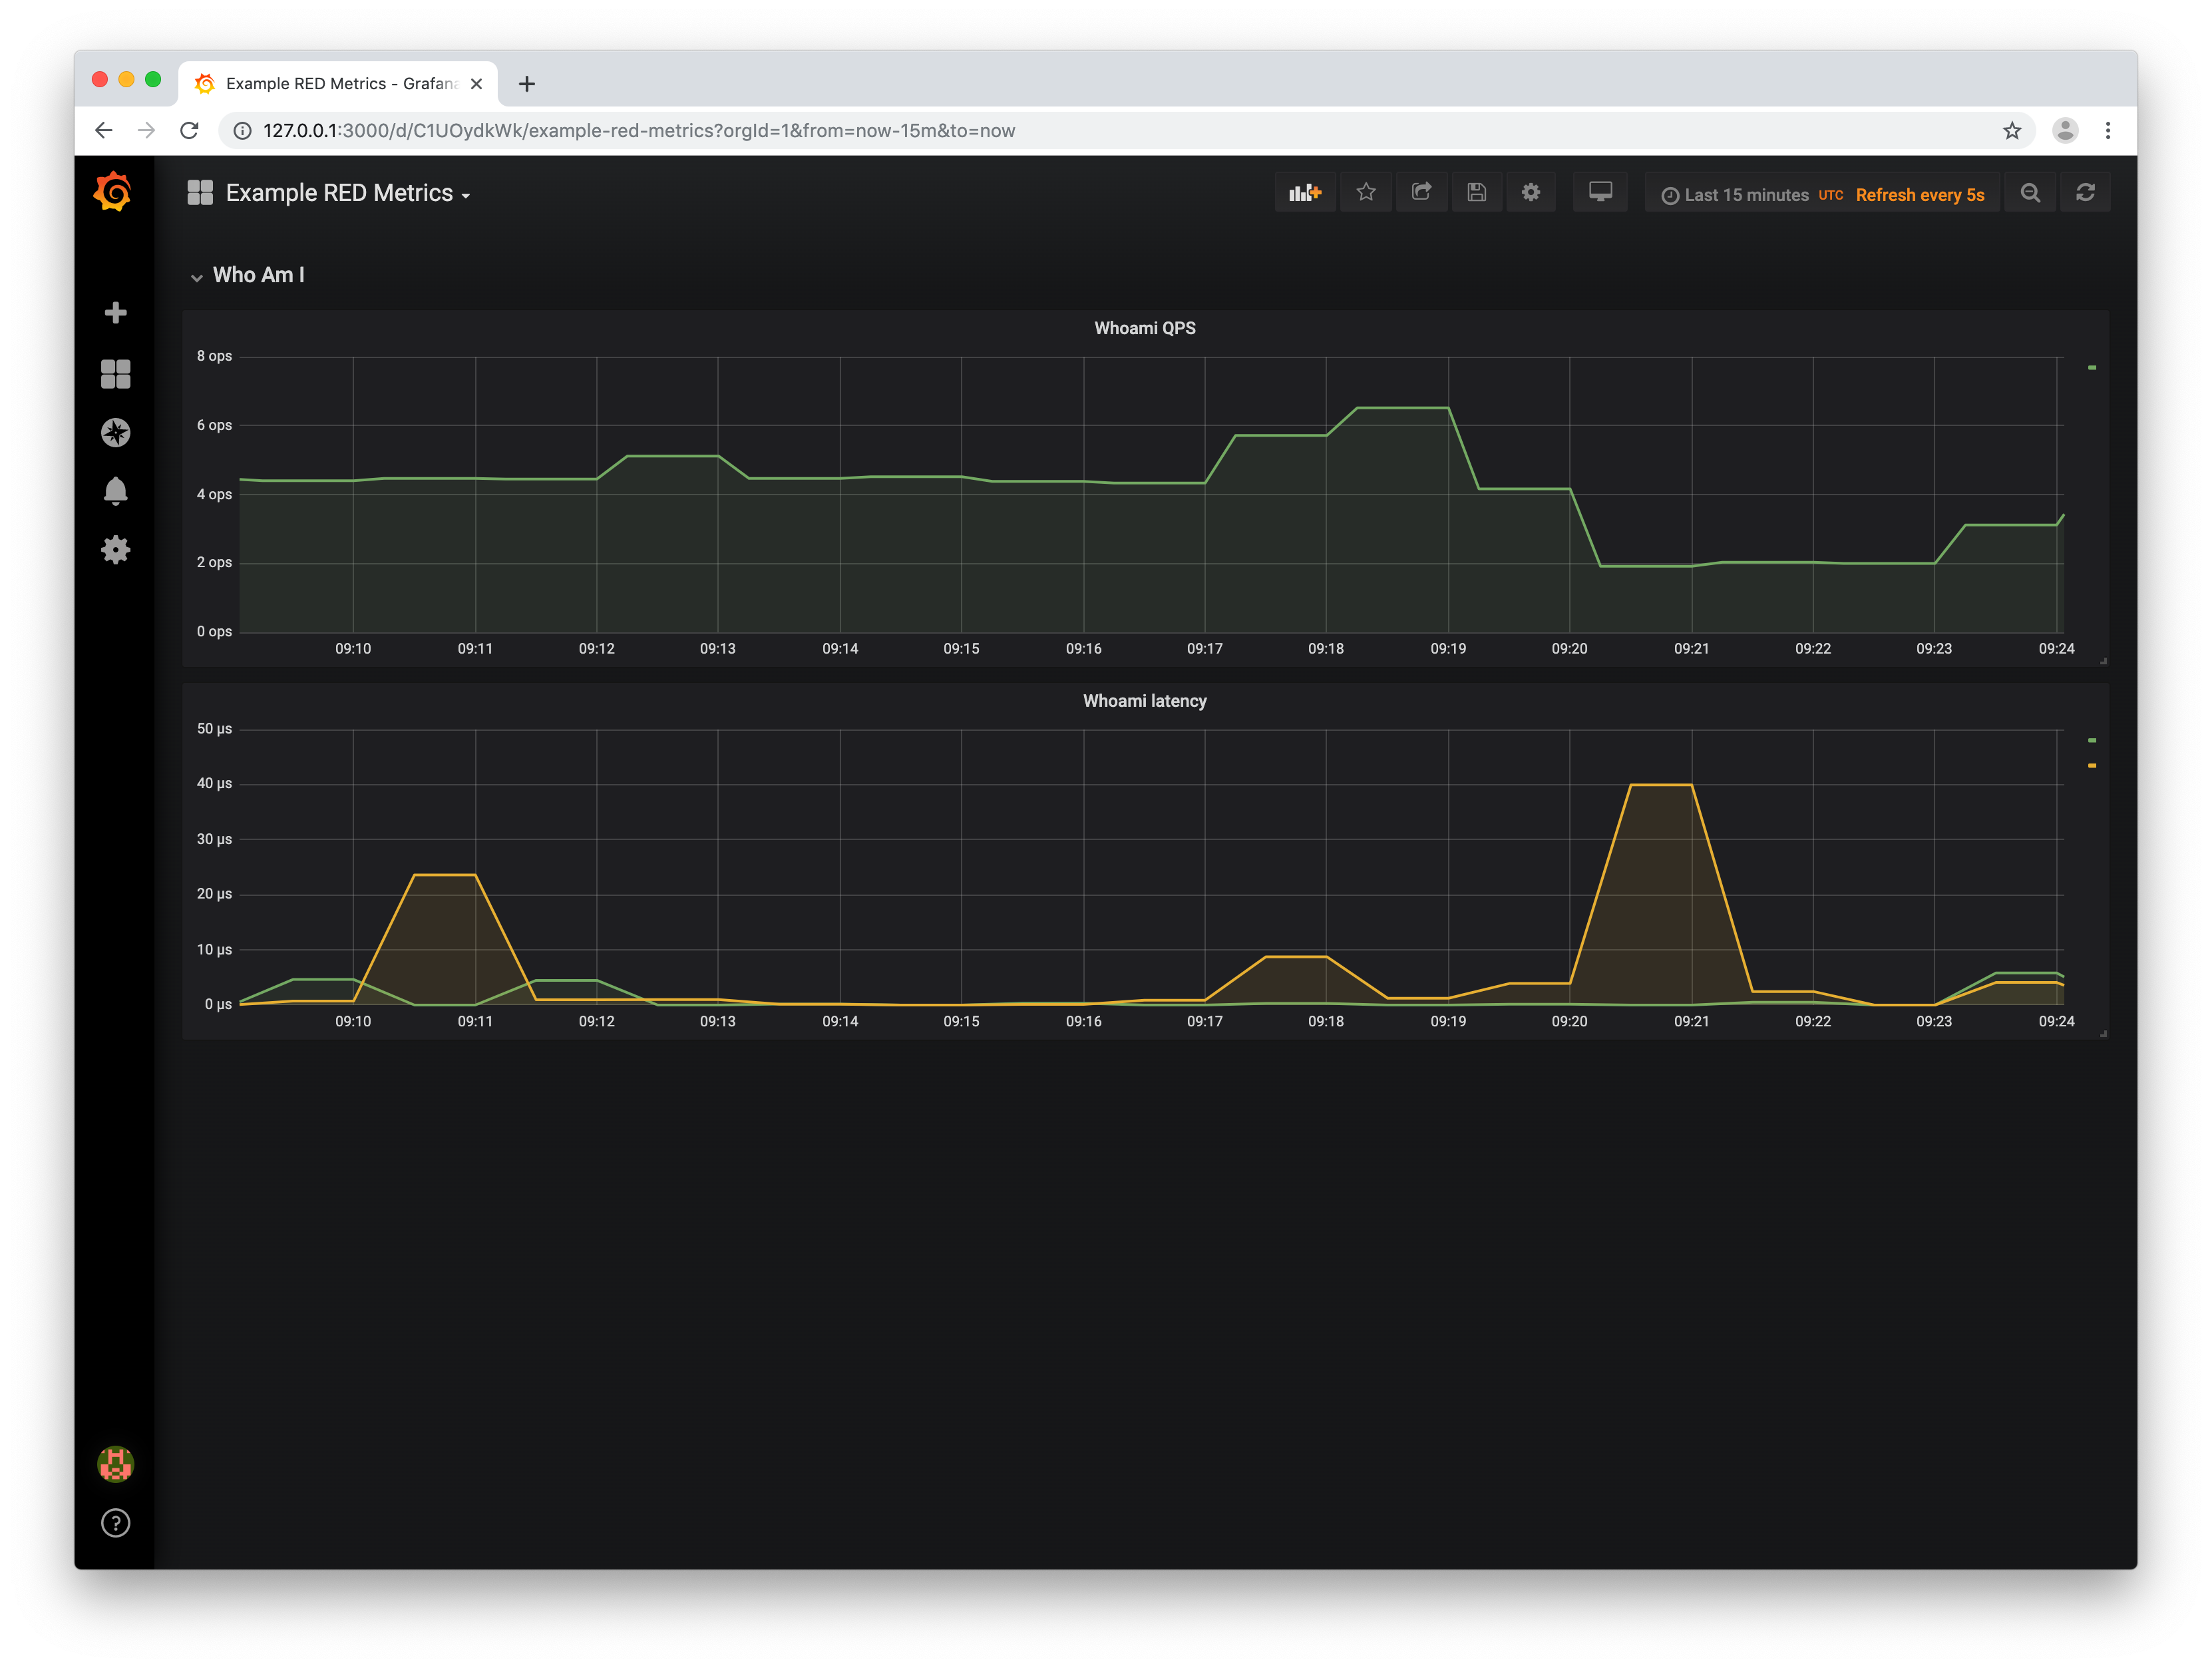
Eine ausführliche Dokumentation zur Konfiguration der Dashboards und Datasources sowie alternative Methoden zum Einbinden dieser findest Du im Grafana Helm Chart Repository.

Im zweiten Teil der Serie geht es um die Dashboardentwicklung und worauf dabei zu achten ist. \


- Jan